


Excess winter rainfall data released to fine-tune crop nitrogen plans
Register for free to read more of the latest local news. It's easy and will only take a moment.

UK winter rainfall has generally been above average, which has implications for nitrogen management in cereals and oilseed rape, according to AHDB.
Many UK regions were already in the highest excess winter rainfall (EWR) category when the interim results were issued in early February (based on October–January data).
The sixth wettest March (since records began in 1836) helped tip further areas into wetter EWR categories in the final data set (based on October–March data).
However, numerous areas are still classified as ‘moderate’ or ‘low’.
Higher EWR is problematic as it is associated with increased nitrate leaching and reduced soil nitrogen supply (SNS).
The results mean many growers will need to consider increasing nitrogen applications for yield and, in some situations, quality.
The news will disappoint growers as they continue to grapple with relatively high fertiliser costs and falling grain prices.
What is excess winter rainfall (EWR)?
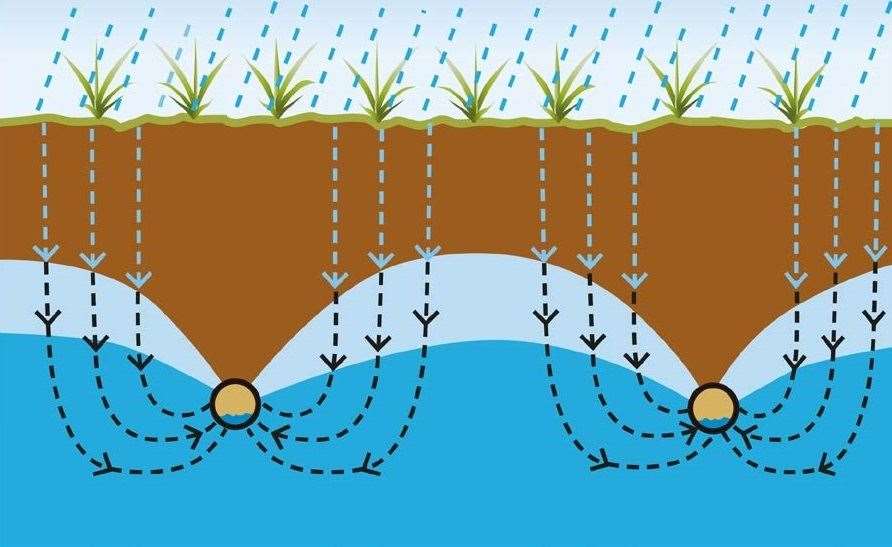
EWR reflects the amount of rainfall the land receives after the soil profile becomes fully wetted in the autumn (field capacity) and before the end of drainage in the spring. It can be used to indicate how much nitrate has leached into drainage water.
AHDB uses Met Office data to map EWR across the UK (199 40 km by 40 km grid) using three categories -
Low: less than 150 mm EWR
Moderate: 150 to 250 mm EWR
High: over 250 mm EWR
Two map types are created: for bare soil and cropped land.
The latter maps (for winter wheat, winter barley and winter oilseed rape) account for water lost through the crop.
The EWR categories correspond to three look-up tables in section 4 of the AHDB Nutrient Management Guide (RB209), which can be used to estimate a field’s SNS Index and help determine recommended nitrogen rates.
Winter 2022/23 (final) -
The interim EWR data, based on the first four months (October–January) of the full EWR period (October–March), indicated that the UK was on track for a wetter-than-average winter.
Emma Willis, who manages nutrient management research at AHDB, said: “February and March saw extreme rainfall contrasts.
"Generally, rainfall was well below average in February and well above it in March.
Relatively high rainfall led to a greater number of high EWR areas than average in the final EWR results. As usual, lower EWR areas tend to cluster in the East of England and East Midland regions.”
To plan nitrogen applications, use the nitrogen calculator, follow RB209 guidance and access the EWR maps on the AHDB website: ahdb.org.uk/ewr