


What the daily figures on new Covid-19 cases do – and don’t – tell us
Register for free to read more of the latest local news. It's easy and will only take a moment.
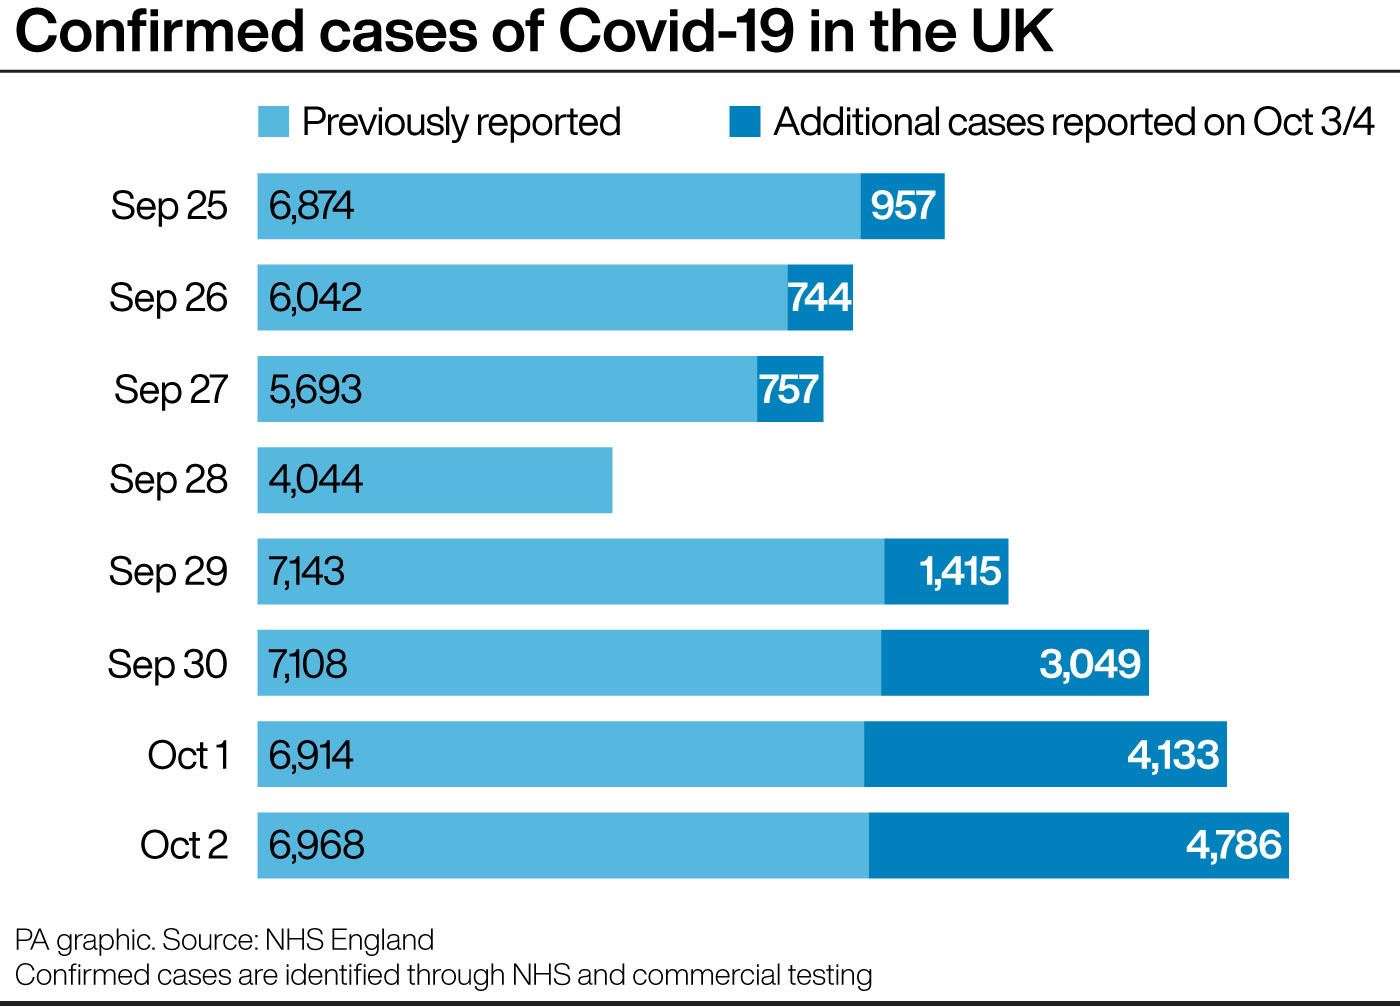
The way in which nearly 16,000 previously unreported cases of coronavirus in England have been added to the UK’s official total illustrates some of the challenges in making sense of the daily statistics on Covid-19.
Each day a number is published on the Government’s coronavirus dashboard showing how many more people have tested positive.
But this is not the number of new cases of Covid-19 that have been recorded in the past 24 hours.
Instead, it is the number of new cases reported to the Government in the past 24 hours.
Some of those cases will date back several days – occasionally even weeks.
As such, this number is not a real-time snapshot of how many people are testing positive.
There has always been a lag in data on new cases, due to the time it takes to process the information and incorporate it into the official total.
A positive case of Covid-19 confirmed in a laboratory yesterday or today is not likely to show up in the figures for at least 24 hours, usually longer.
This is why the number of new cases reported each day, and in particular the change on the previous day’s total, should be treated with caution.
It is also why the weekly rate of new cases in local areas – the number of new cases of Covid-19 per 100,000 people – are never calculated for the seven days up to today’s date.
If they were, they would include data that is incomplete and would therefore give a misleading picture.
The lag between a case being confirmed and that case showing up in the official figures can be seen when comparing the difference between the number of cases by specimen date – in other words, the date a positive case is confirmed – and the number of cases by reported date.
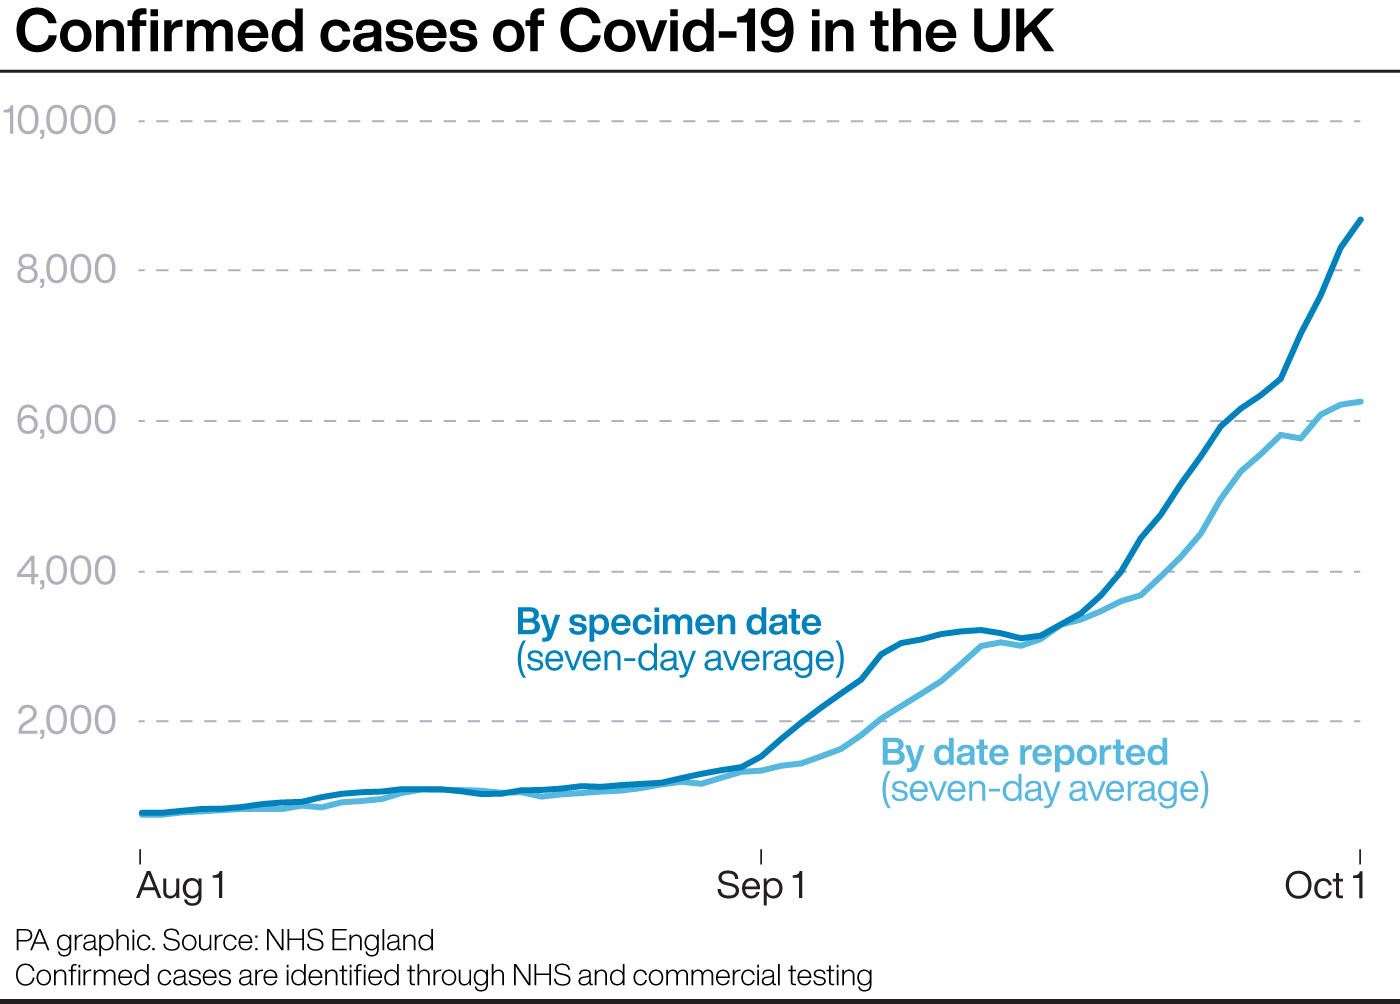
The latest available data, including those 15,841 “missing” cases that have now been incorporated into the figures, shows that as of October 1 the seven-day average for cases by specimen date stood at 8,688.
By contrast, the seven-day average for reported cases as of October 1 was 6,260.
The gap between these two numbers has been getting larger.
At the start of September both figures were broadly similar, suggesting on average there was a quick turnaround between someone testing positive and the case being reported.
But during September the difference between the numbers started to increase and the number of reported cases began tracking below the number of cases by specimen date.
Those 15,841 additional cases, which were incorporated into the figures over the past two days, have made the gap even wider.
It means that – for the time being – the daily statistics on the number of cases of Covid-19 are even more tricky to interpret than usual.
As with the daily statistics on Covid-19 deaths, it is perhaps more useful to look at the trend over time rather than the day-on-day change.